M. Hasnain

MuhammadHasnain

GeoAI developer and meteorologist at the National Disaster Management Authority, Pakistan

Reading the Earth from space and the sky from data, then turning it into elegant agentic systems.

Muhammad Hasnain

Work

I build web portals that turn satellite, station and forecast data into maps a disaster manager can act on.

Heatwave Intelligence

A portal for NDMA Pakistan

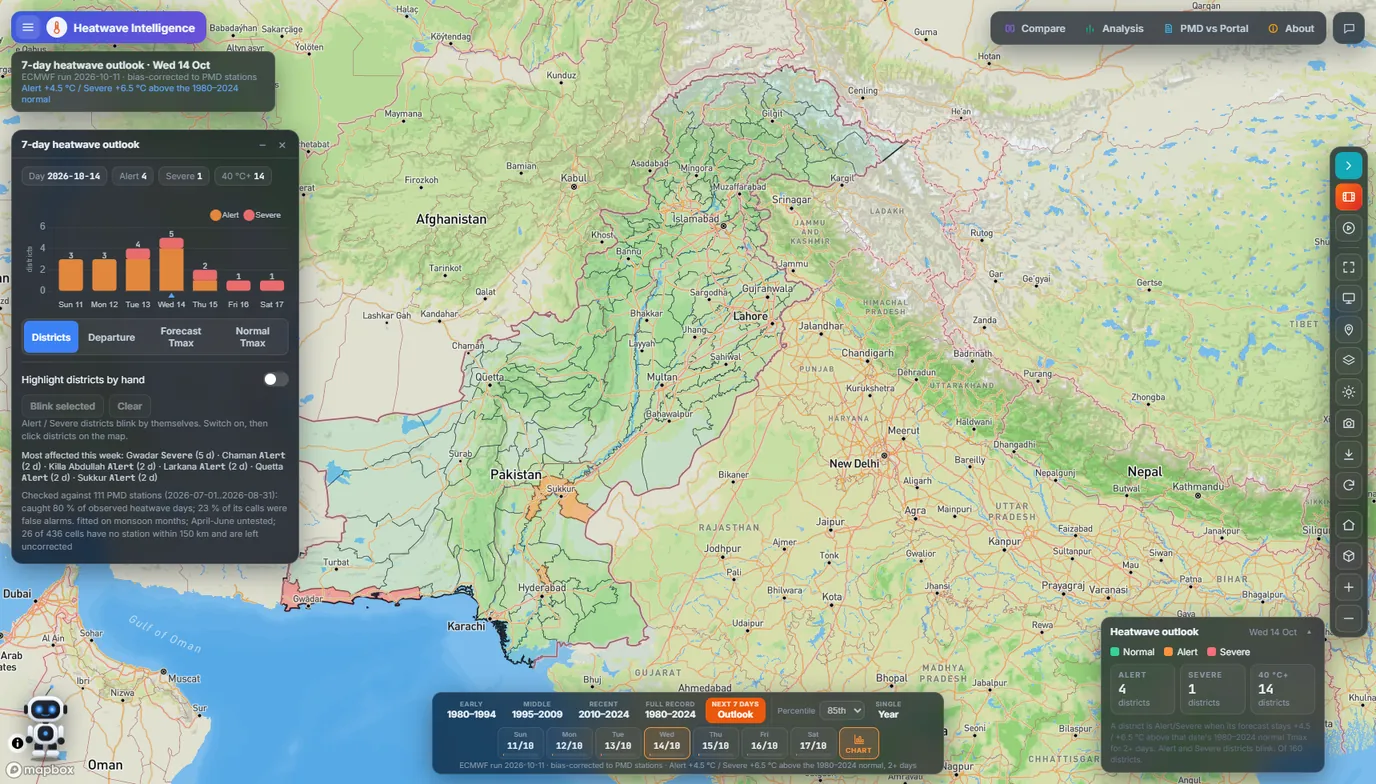
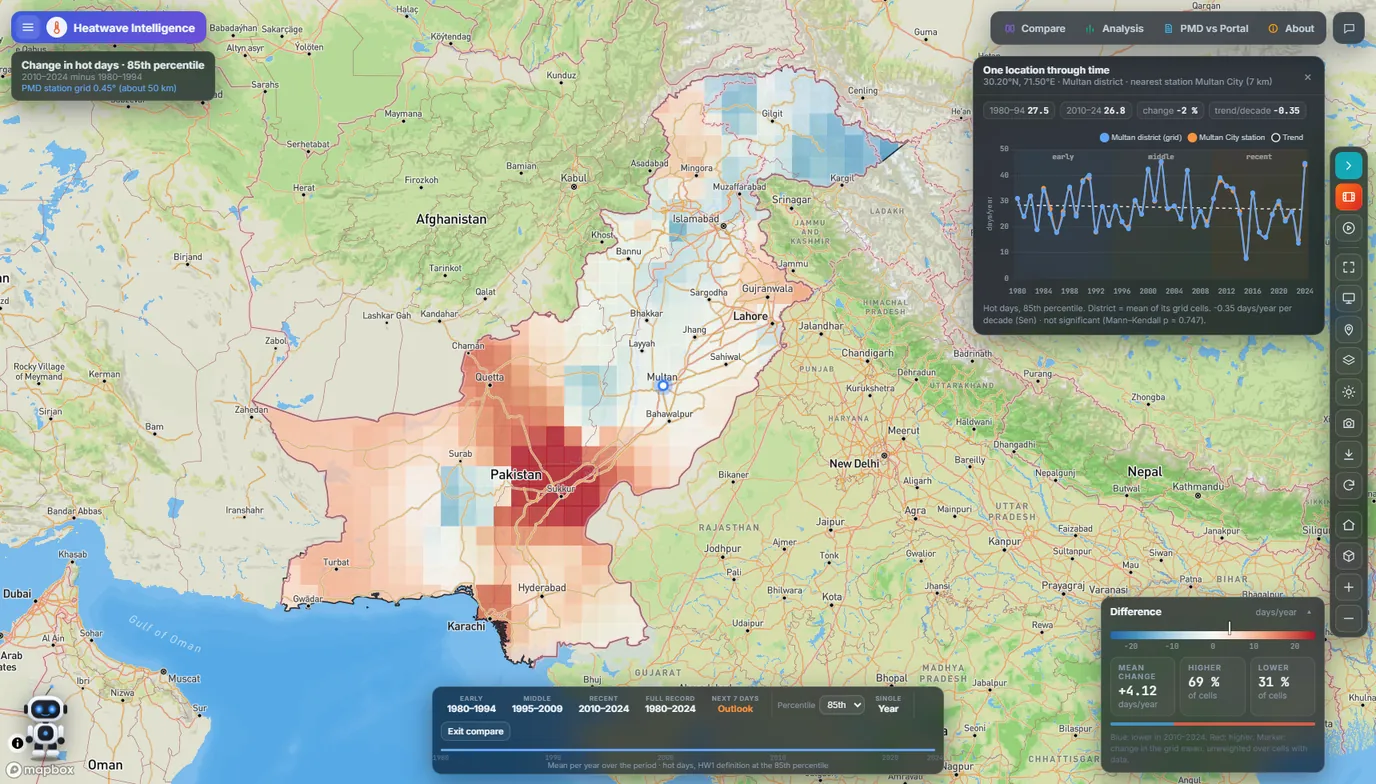
Shows how heat in Pakistan has changed since 1980, and which districts face a heatwave in the next seven days.

Built with Mapbox GL JS, plain JavaScript, a FastAPI backend and Python climate tooling.

Watch the demo video on LinkedIn. Screens and details on GitHub.

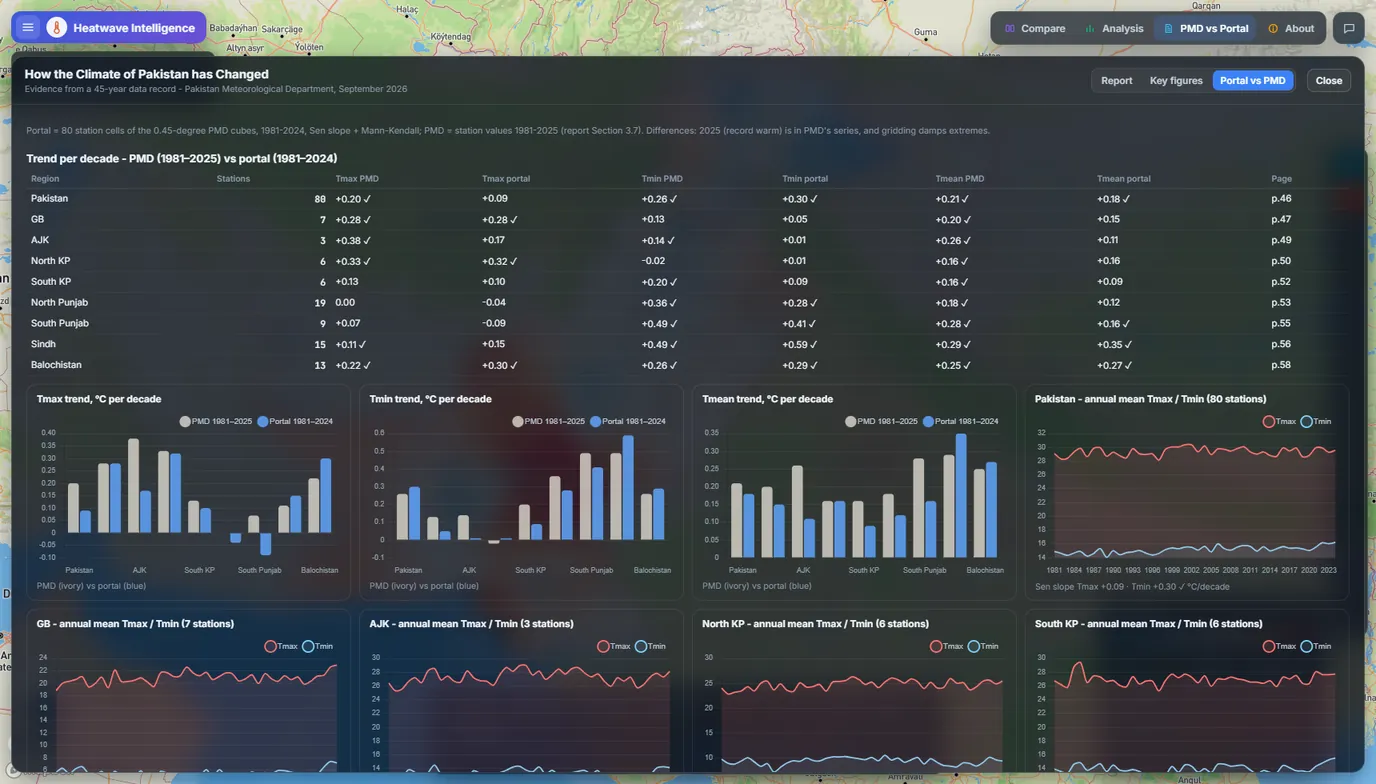
  • 45 years of station data on one mapPMD records from 1980 to 2024 on a 0.45° grid (about 50 km), with five heatwave measures at four percentile thresholds.
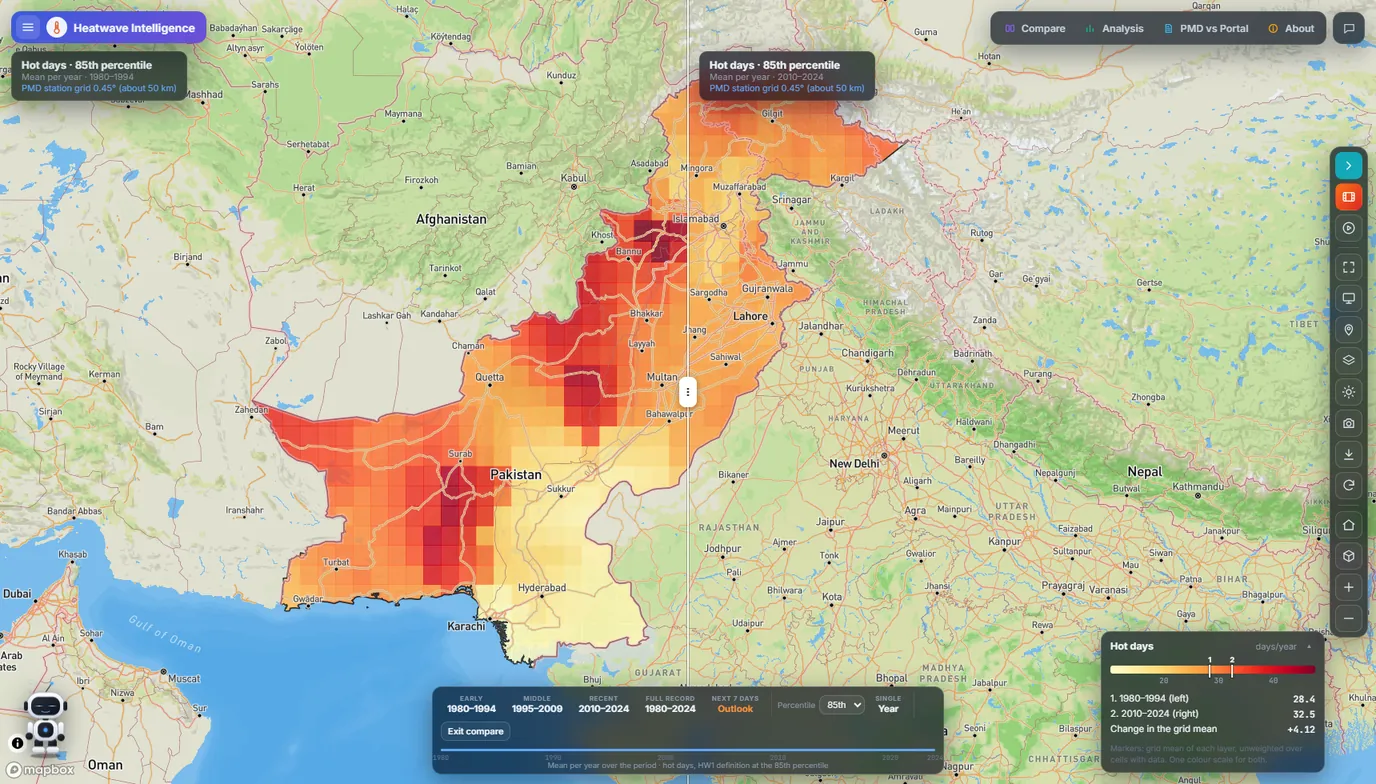
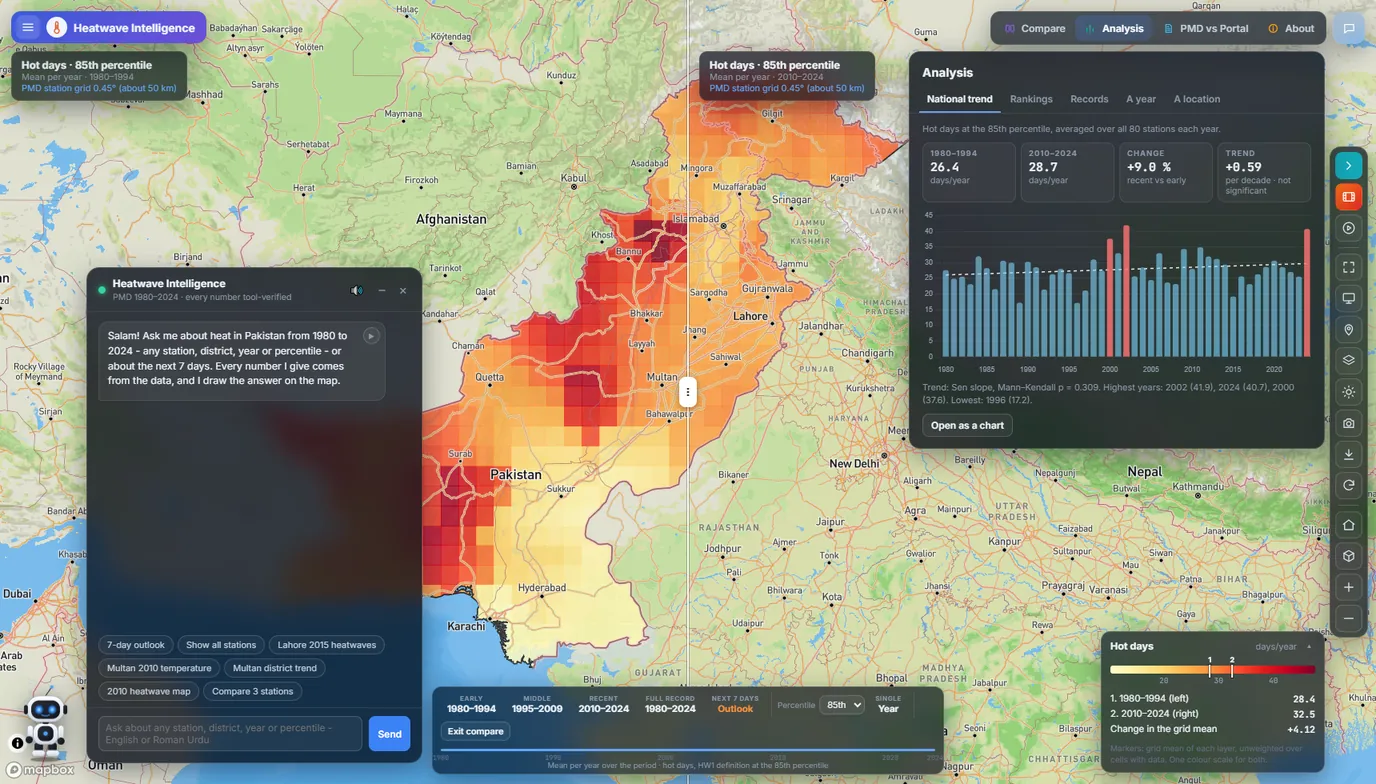
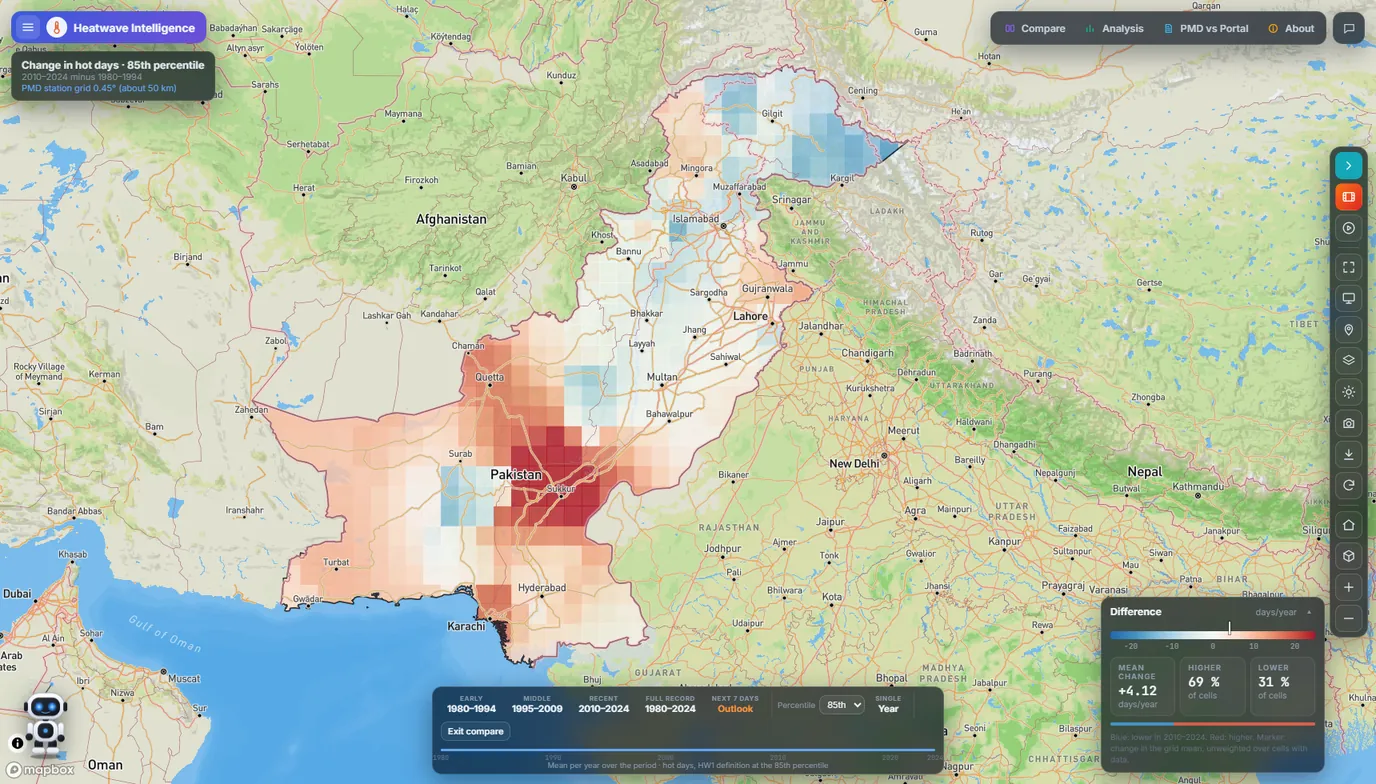
  • Compare periods and yearsA swipe, side-by-side or difference view between any two periods or years.
  • Trends, rankings and recordsA Mann-Kendall trend test with Sen's slope, national and station rankings, all-time records, and a chart for any place.
  • 7-day heatwave outlookThe ECMWF forecast, bias-corrected to 111 PMD stations. A district goes to Alert or Severe when the forecast stays 4.5 °C or 6.5 °C above that date's normal for two days or more.
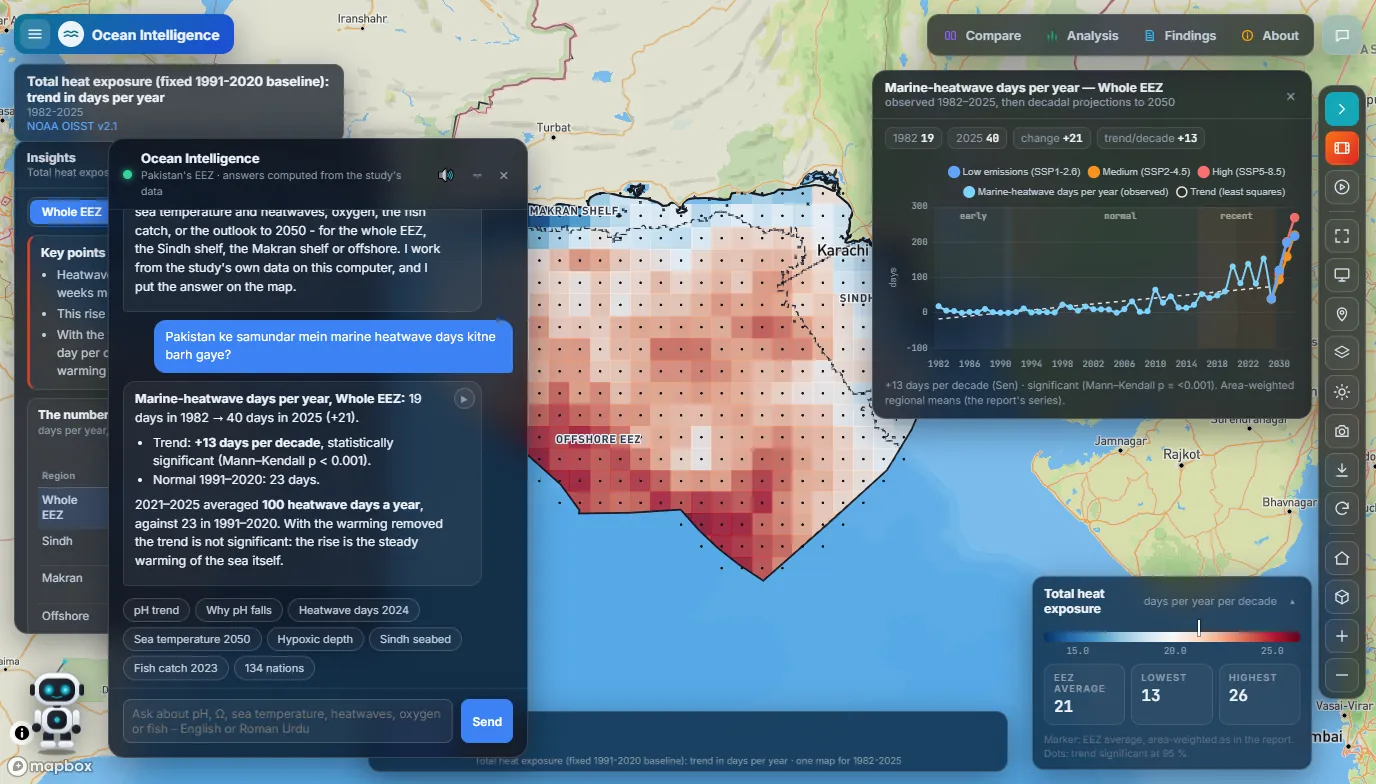
  • A chat assistant that answers with dataQuestions in English or Roman Urdu. Every number it gives comes from a data tool, and it draws its answer on the map.
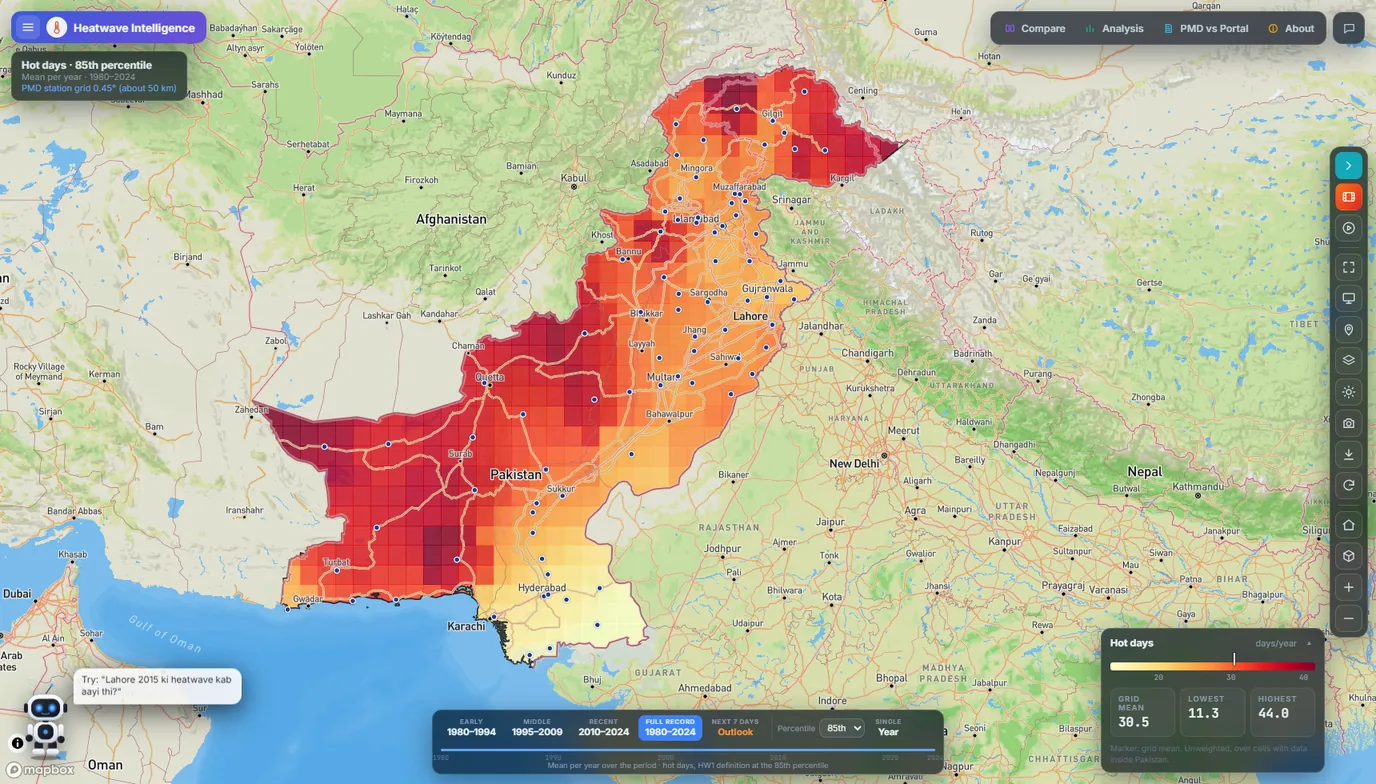
Heatwave Intelligence portal: a map of Pakistan coloured by hot days per year, 1980 to 2024, at the 85th percentile, darkest in Balochistan and the north.
Hot days per year at the 85th percentile, 1980–2024. The highest counts sit in Balochistan and the far north.

Checked against the record. Tested on July and August 2026 against 111 PMD stations, the outlook caught 80% of observed heatwave days, and 23% of its calls were false alarms. The portal prints this beside the forecast, along with the months it has not been tested on yet.

Ocean Intelligence

A portal for NDMA Pakistan

Shows how acidity, heat and oxygen in Pakistan's seas have changed since the 1980s, and where they are heading by 2050.

Built with Mapbox GL JS, plain JavaScript, Chart.js and a Python analysis pipeline.

Watch the demo video on LinkedIn. Screens and details on GitHub.

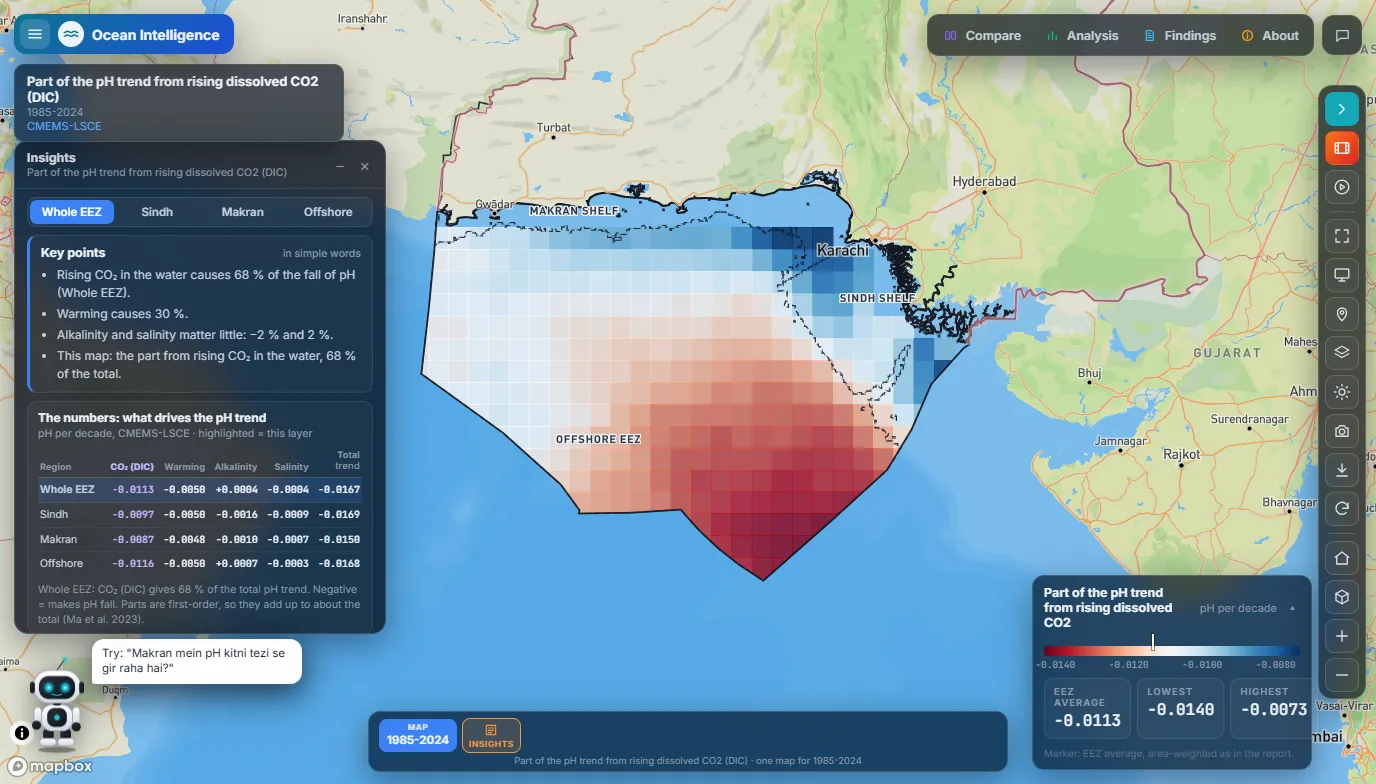
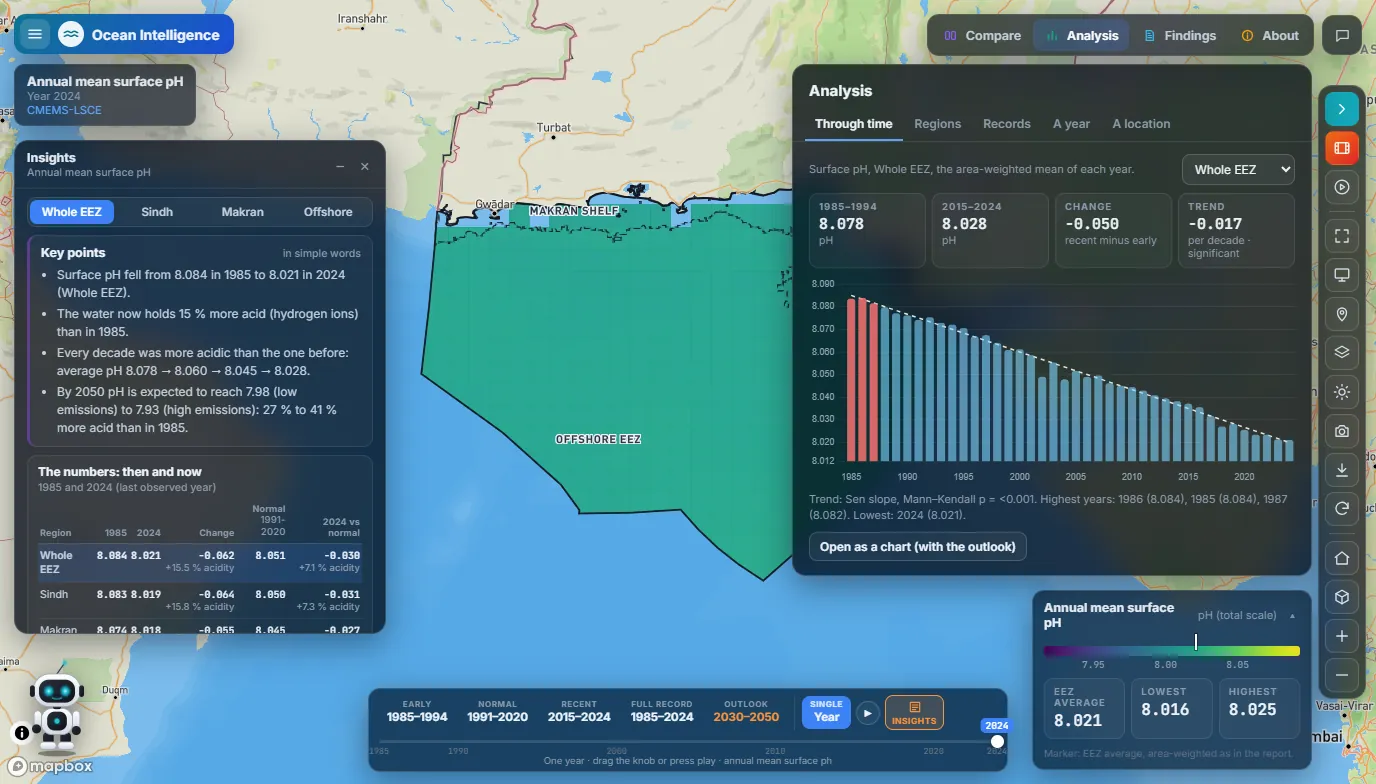
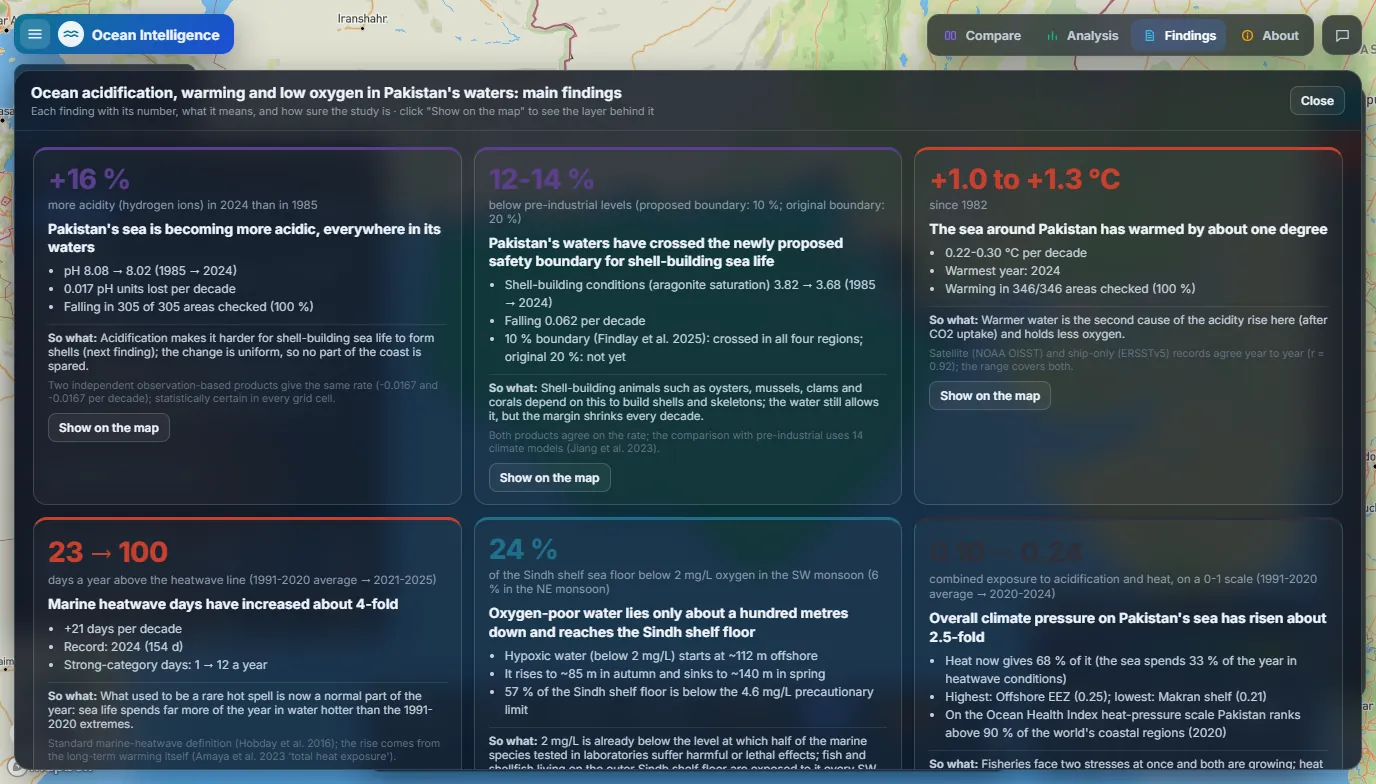
  • Acidification, mappedSurface pH in Pakistan's Exclusive Economic Zone fell from 8.08 in 1985 to 8.02 in 2024, about 16% more acidity, and it fell in every area checked.
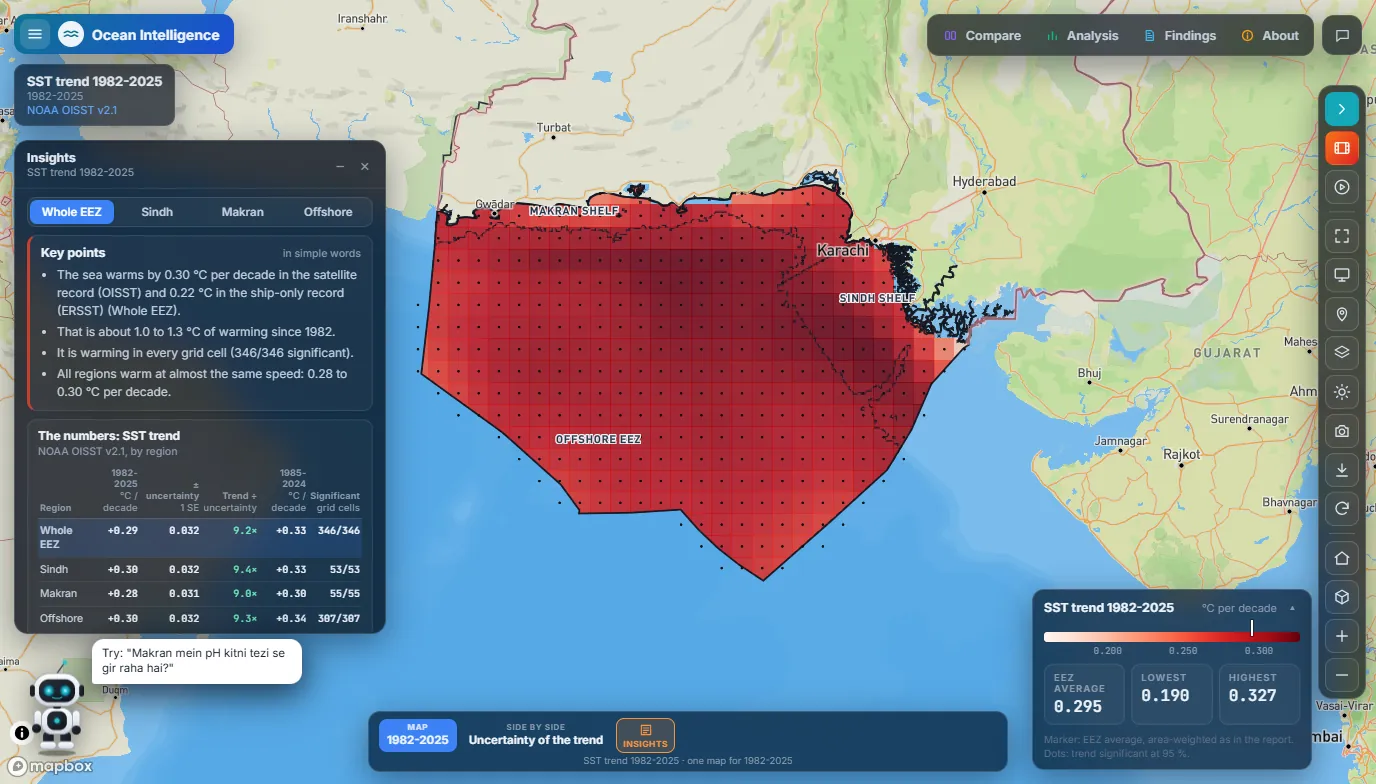
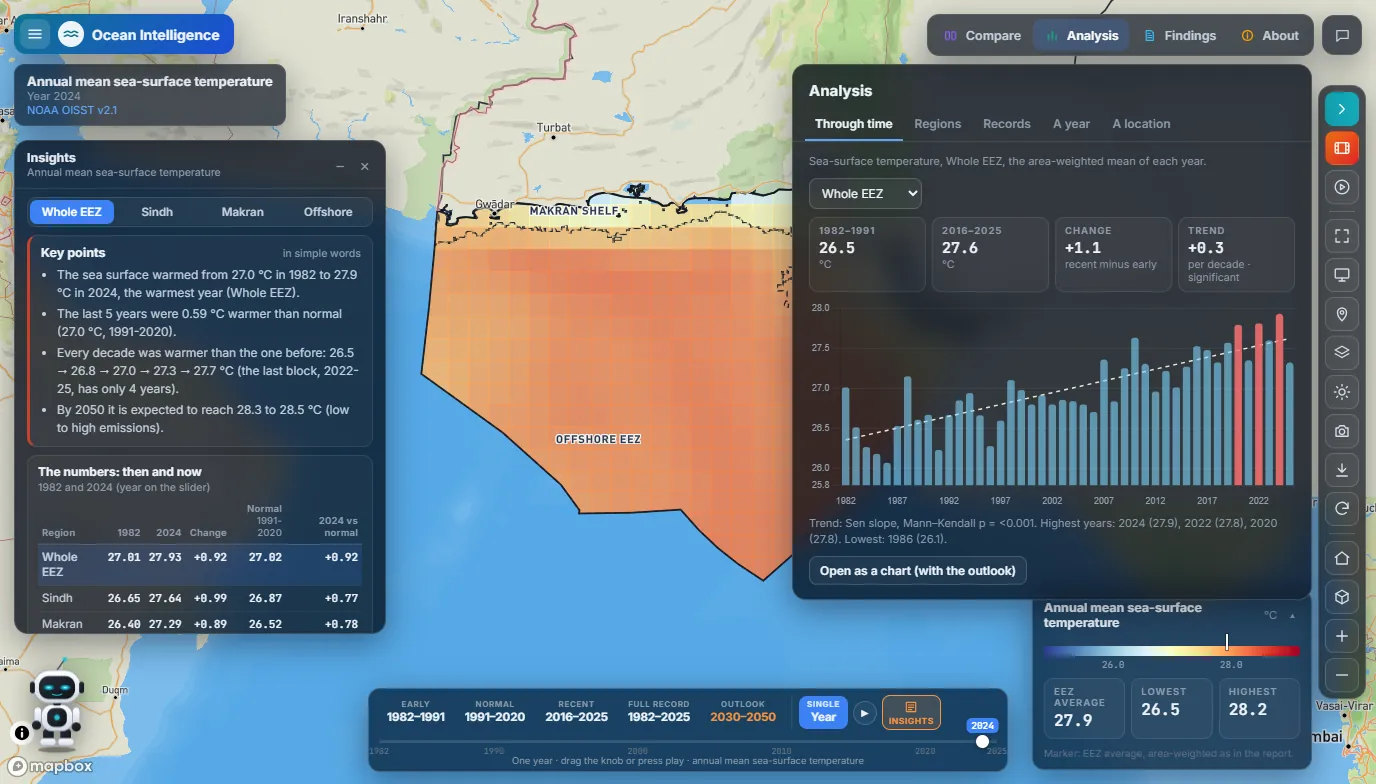
  • Warming and marine heatwavesThe sea has warmed by 1.0 to 1.3 °C since 1982. Marine heatwave days rose from about 23 a year (1991–2020 average) to about 100 (2021–2025).
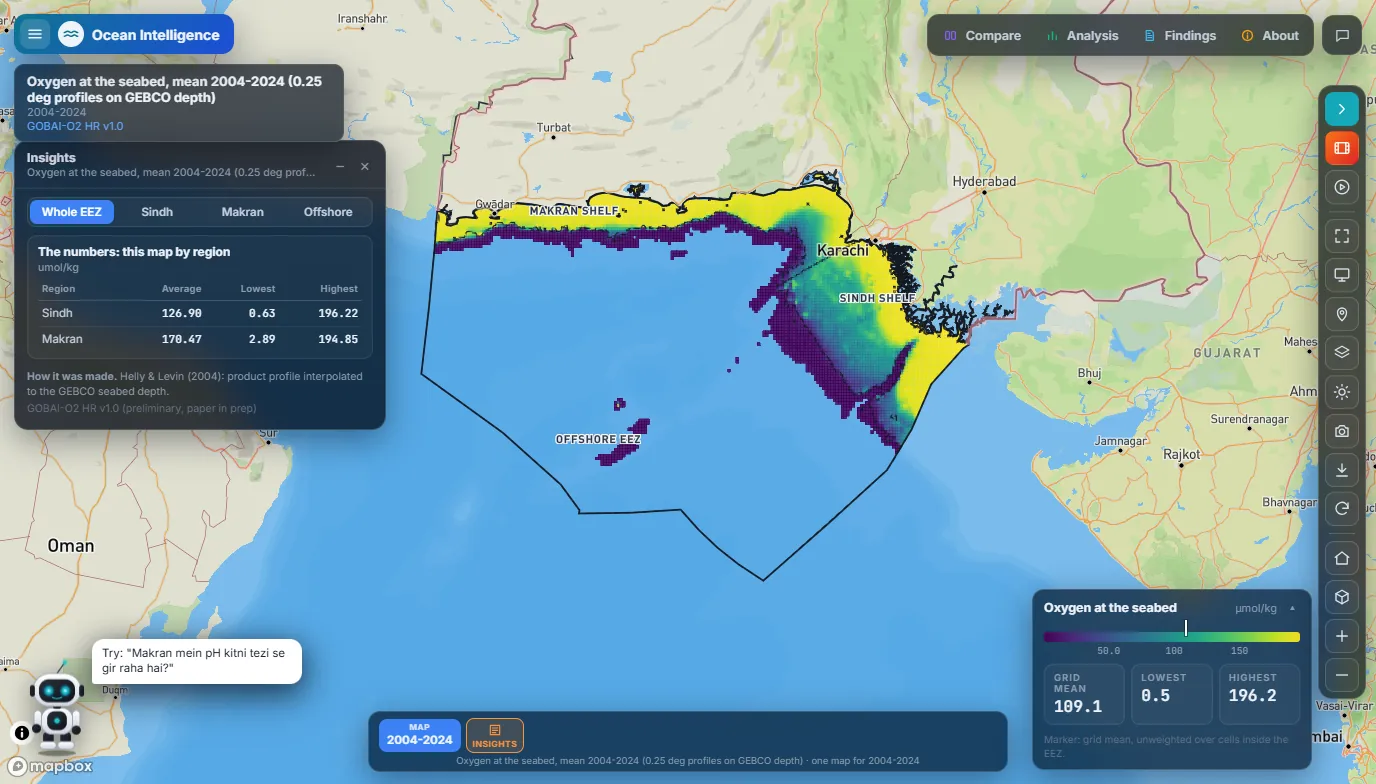
  • Low oxygen on the shelfIn the southwest monsoon, 24% of the Sindh shelf floor sits below 2 mg/L of oxygen.
  • Outlook to 2050Low- and high-emission paths, side by side or against today.
  • A chat assistantQuestions in English or Roman Urdu, answered from the study's numbers.
Ocean Intelligence portal: sea-surface temperature trend per decade across Pakistan's Exclusive Economic Zone, 1982 to 2025, with the insights panel open.
Sea warming per decade, 1982–2025: every grid cell is warming, 0.28 to 0.30 °C per decade by region.

Heatwave and Flood Digital Twin

In development · prototype

The next step after Heatwave Intelligence: a 3D digital twin of a real neighbourhood with two hazard modules, heatwave and flood, that shows what is exposed to each and how vulnerable it is, building by building.

Built with CesiumJS on real 3D geography. Modules: heatwave and flood, both in the same twin.

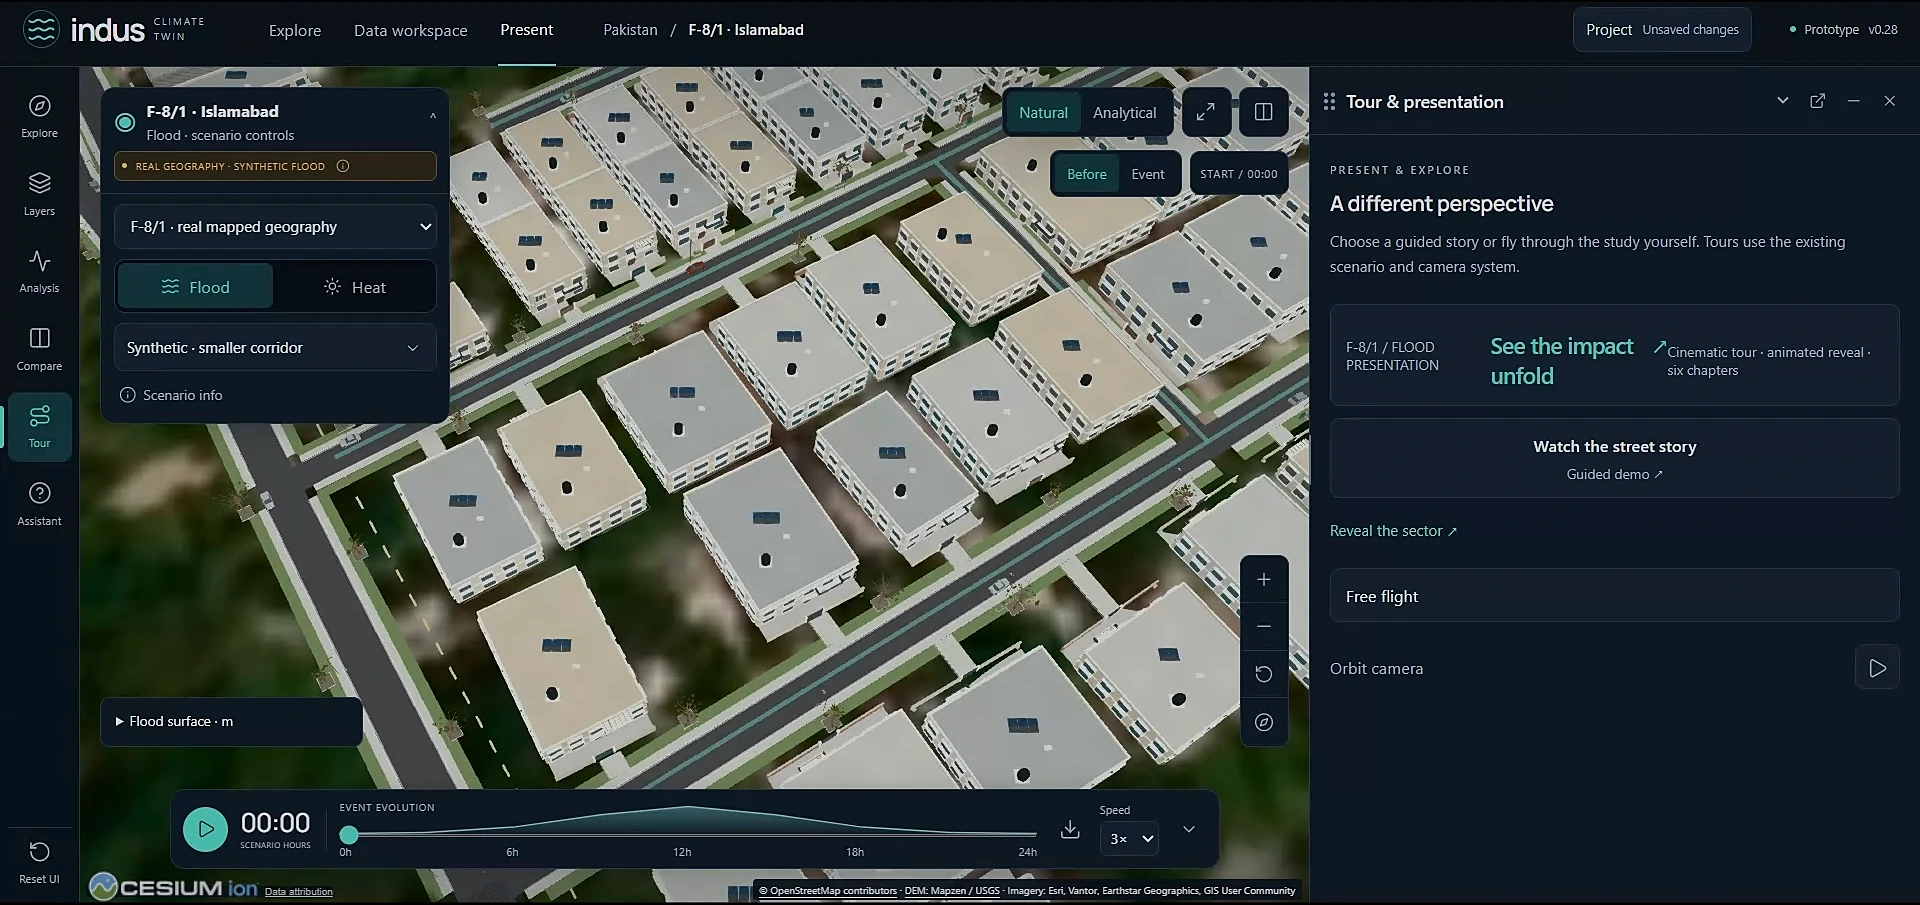
  • Heatwave and flood in one twinBoth modules run on the same 3D neighbourhood and are switched from one scenario panel.
  • Exposure and vulnerabilityWhich buildings and roads sit in harm's way, and how vulnerable they are, mapped down to a single building.
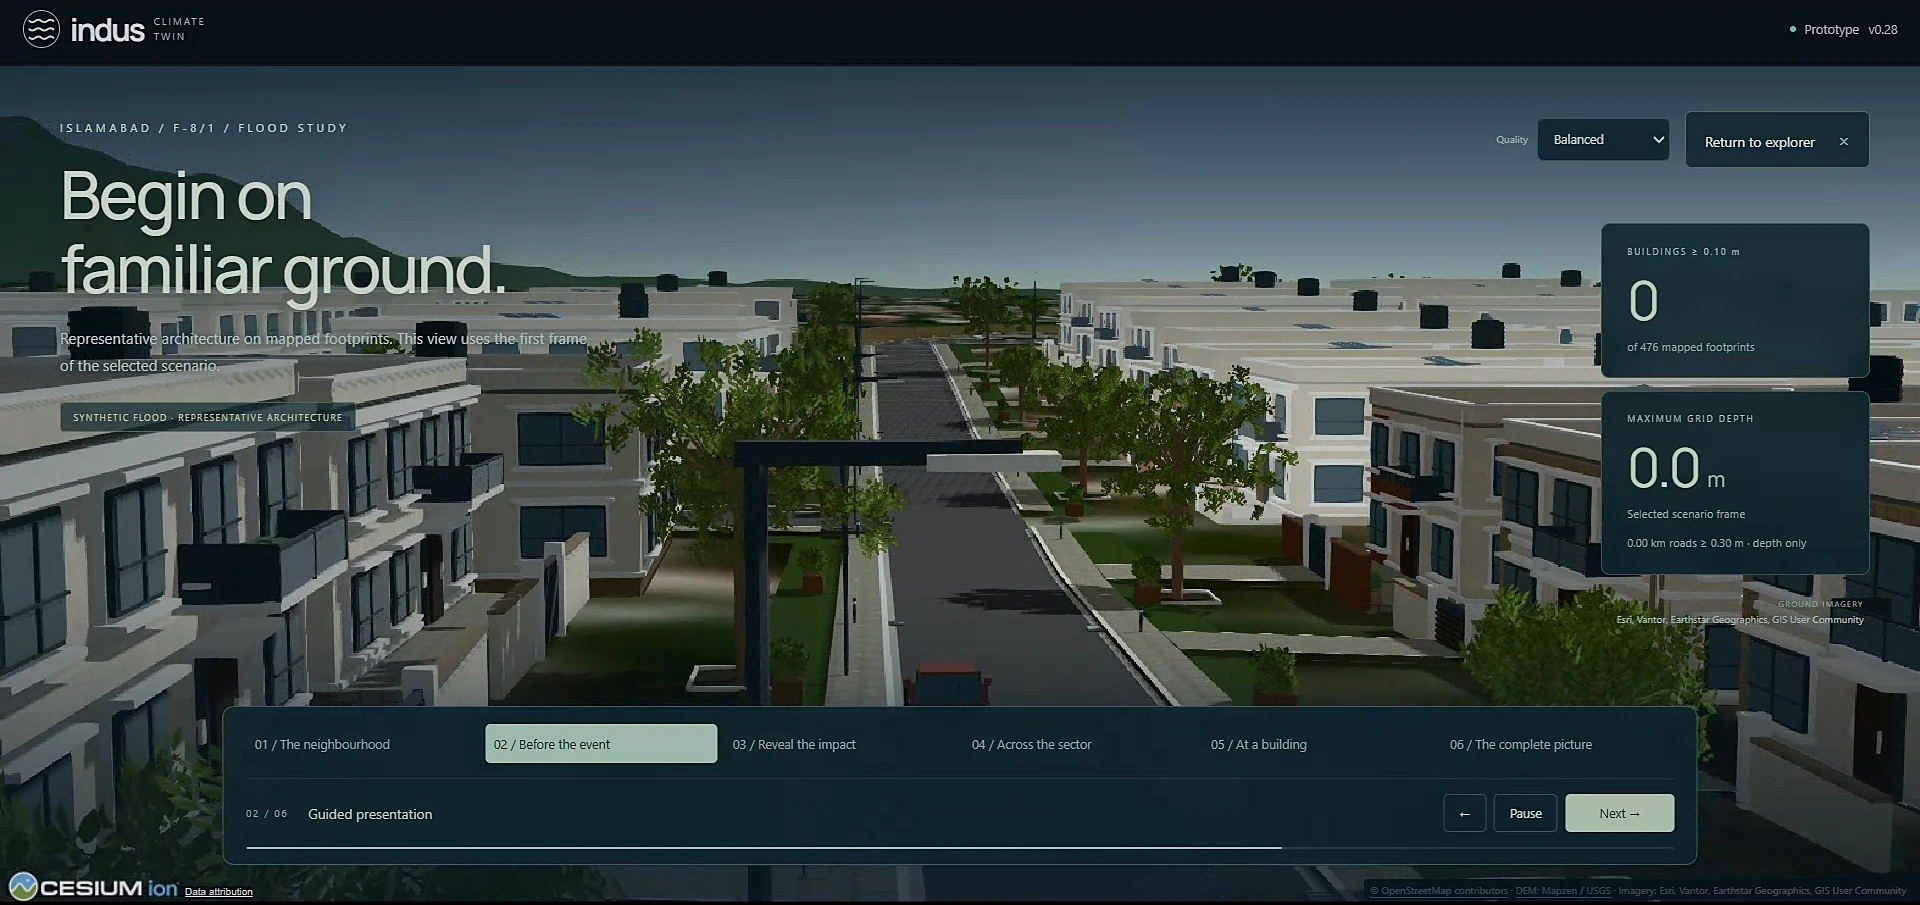
  • A real neighbourhood in 3DIslamabad's F-8/1 sector, with 476 mapped building footprints.
  • Scenarios through timeAn event timeline hour by hour, before and during the event, in natural or analytical view.
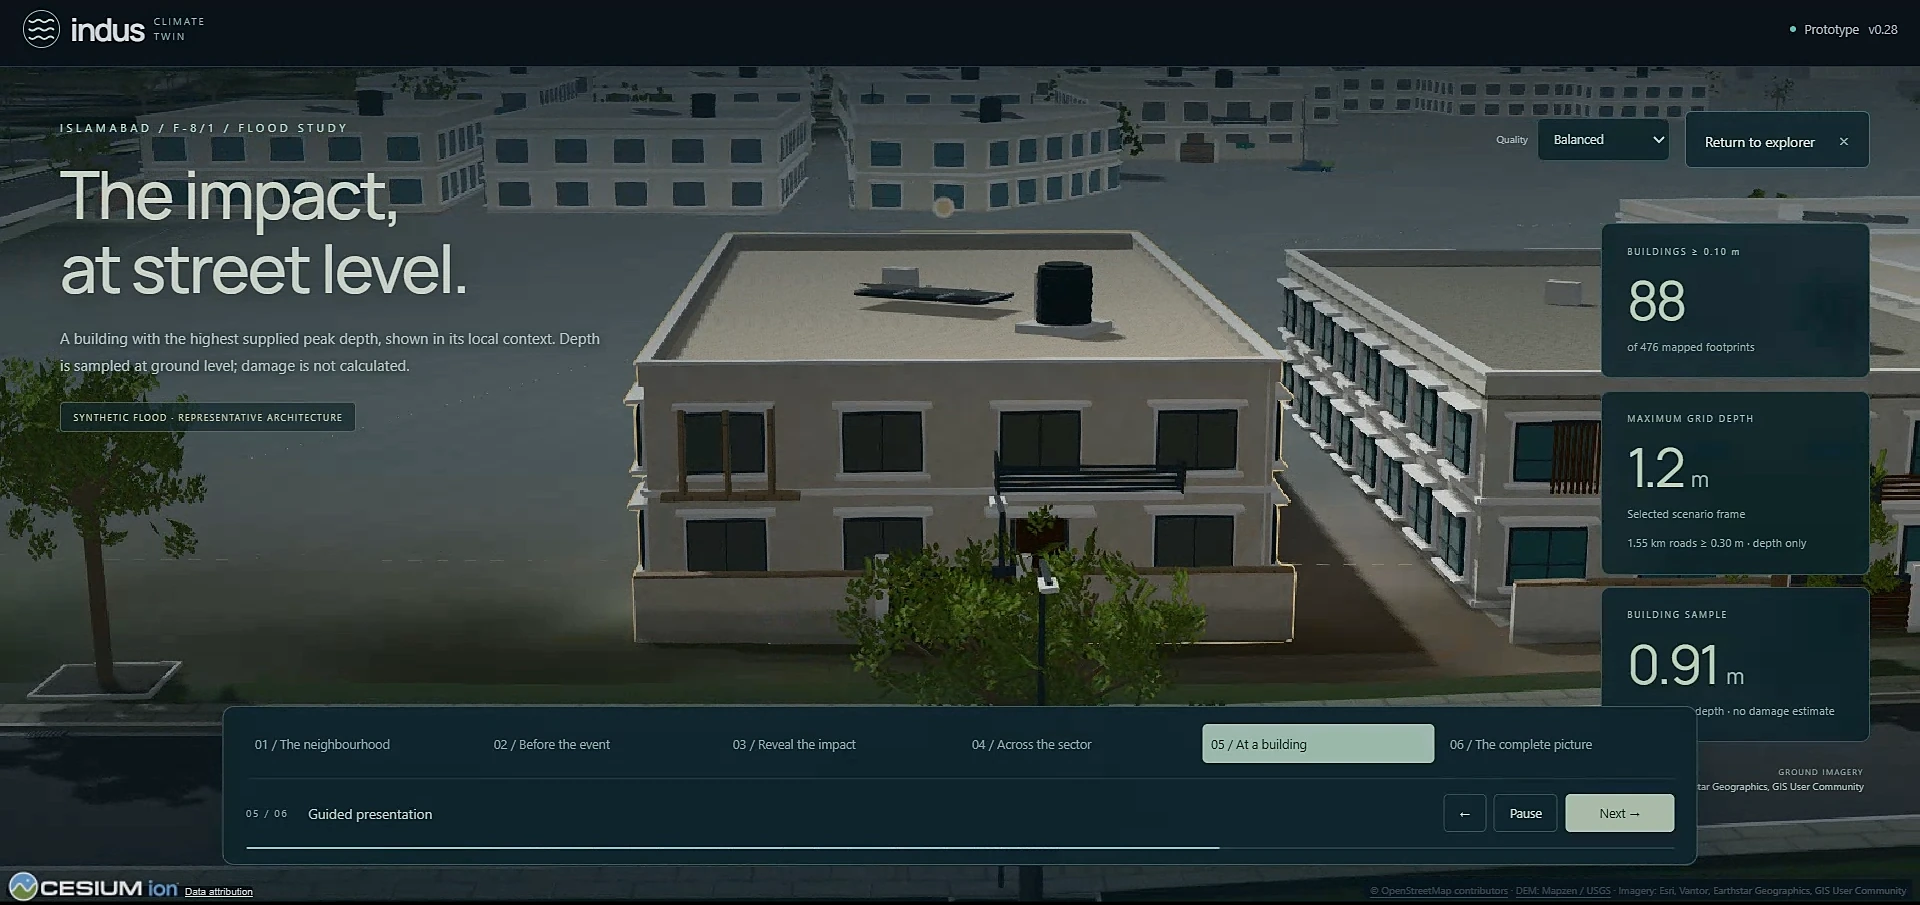
  • A guided storyA six-chapter tour from the whole neighbourhood down to one street and one building.
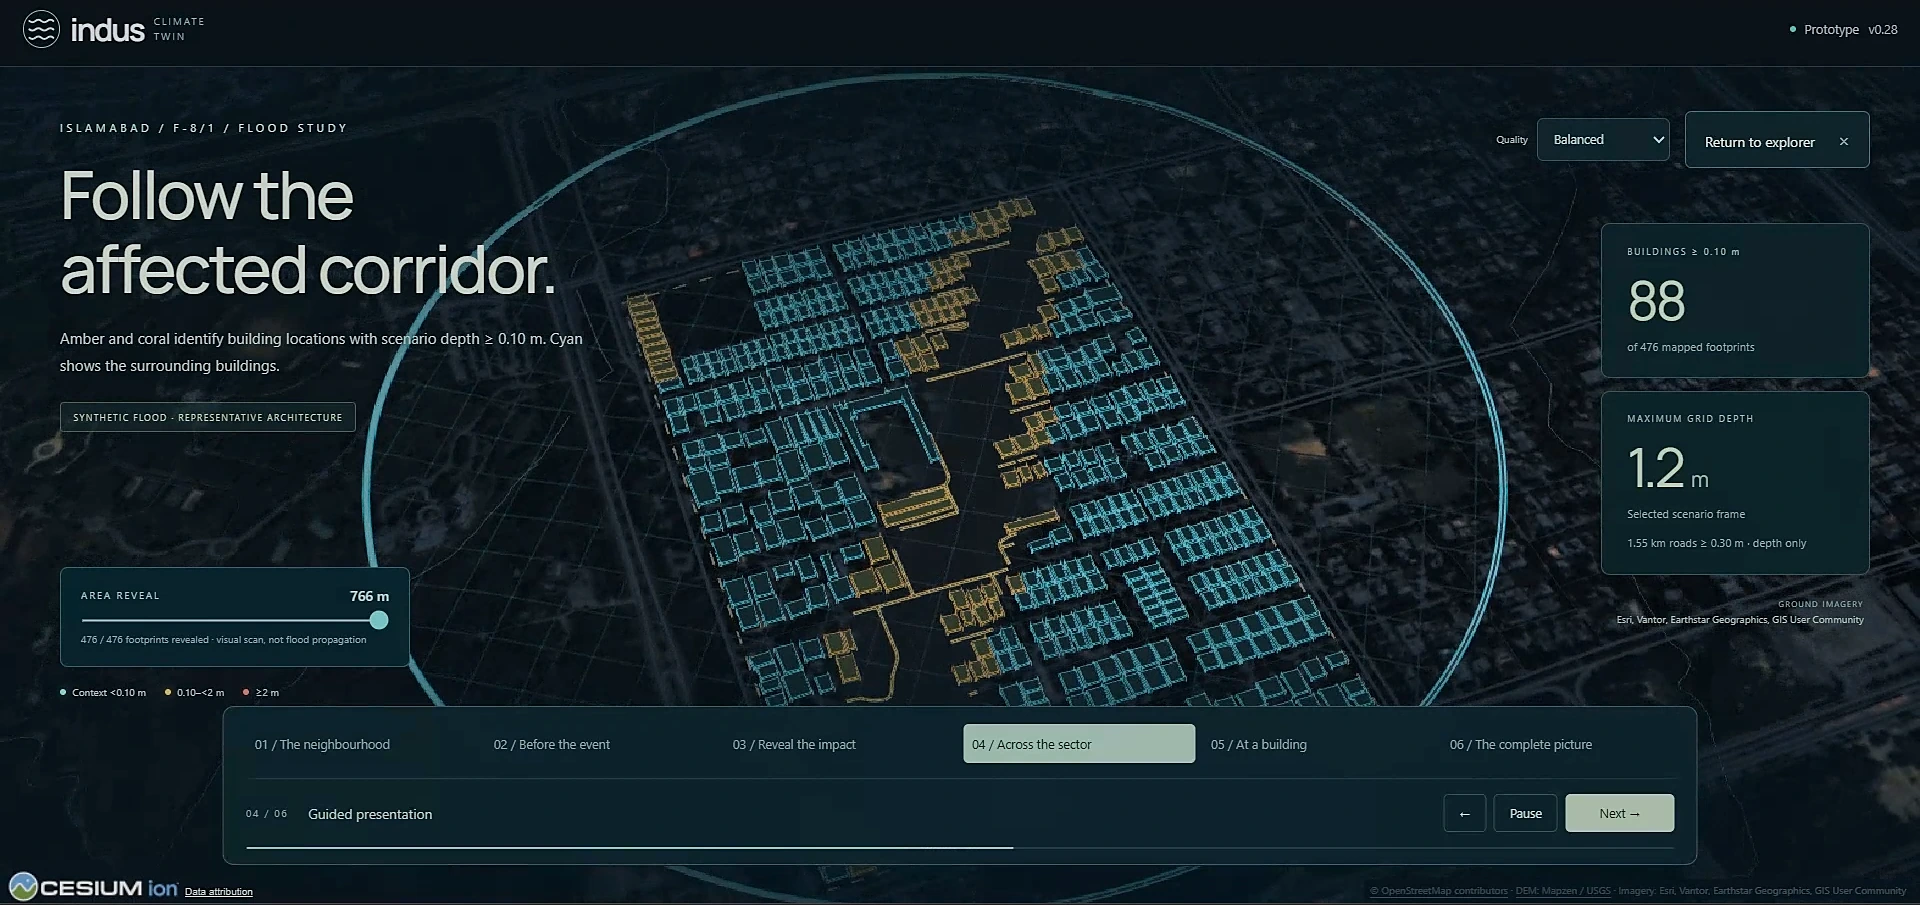
3D view of the F-8/1 sector in Islamabad: building outlines in cyan, with the buildings inside a flood scenario's affected corridor highlighted in amber.
The affected corridor in a test flood scenario: highlighted buildings are the ones the water reaches.

Work in progress. The flood scenario in these screens is synthetic, used to build and test the twin. Both modules are still being built.

In progress

A larger portal I am still polishing. Screens will go up here when it is ready.

This portal's code belongs to NDMA, so it is not public.

More Geo-AI projects

  • Flood Inundation Monitoring portal for NDMA, with an AI agent
  • Drought Monitoring portal for PMD, with an AI agent
  • Crop Water Requirement portal for NDMA
  • Coastal Hazard portal for NDMA
  • Real-estate site selection with machine learning
  • Network analysis for an Ohio county and for Germany, in Python

Experience

From digitising land records to running climate models for national hazard warnings.

  1. Employee, full-time

    National Disaster Management Authority (NDMA) Pakistan, Islamabad

    Building the NDMA Cloud-based Early Warning System: forecasts, flood, drought, crop water and heatwave modules on one map, with a FastAPI backend and an AI briefing assistant. Bias-corrected the 7-day heatwave outlook on 111 PMD stations.

  2. Intern

    Senate of Pakistan, Parliament House, Islamabad

    Wrote a Python tool that replaced manual Excel payment processing, cutting the work from hours to seconds.

  3. Image Annotator, part-time

    TerraSkyAI Inc., remote

    Labelling image data used to train and evaluate computer vision models.

  4. Meteorology Intern

    Pakistan Meteorological Department

    Built a Python model that automates drought mapping across Pakistan from several drought indices.

  5. Meteorology Intern

    Pakistan Meteorological Department

    Worked with satellite data for forecasts and extreme-weather reports, built an Android app that gives farmers crop guidance, and a rainfall prediction model in Python.

  6. GIS Analyst

    Geo Mapping Solutions Pvt Ltd, Islamabad

    Processed multispectral and hyperspectral imagery, digitised land parcels, georeferenced Mussavi sheets, and built geodatabases with topology checks and thematic maps.

Research

Five studies I have carried out on Pakistan's climate and land.

  • Localized changes in heatwave dynamics across Pakistan, and their link to large-scale climate patterns
  • Heatwaves triggering flash droughts across Pakistan, traced with remote-sensing indicators
  • Integrated drought mapping across Pakistan from several drought indices
  • Land use and land cover change in the Potohar region, and what drives it, from multi-temporal satellite data
  • A decision support system for farmers by agro-climatic region, delivered as an Android app

Skills

The tools I use day to day.

Remote sensing and GIS

  • Google Earth Engine
  • ArcGIS Pro
  • QGIS
  • ENVI
  • Pix4Dmapper
  • Cartography

Climate and weather

  • GrADS
  • CDO
  • DSSAT crop modelling
  • Climate data analytics
  • Heatwave and drought indices

AI and machine learning

  • Agentic AI
  • Large language models
  • Machine learning
  • Roboflow
  • Data annotation

Software

  • Python
  • R
  • FastAPI
  • Leaflet and Mapbox GL JS
  • Full-stack web development

Education

PMAS Arid Agriculture University, Rawalpindi

Bachelor of Science in Geo-informatics
2022 – 2026 (completed April 2026), CGPA 3.73

Certificates

Open any certificate to see the original PDF.

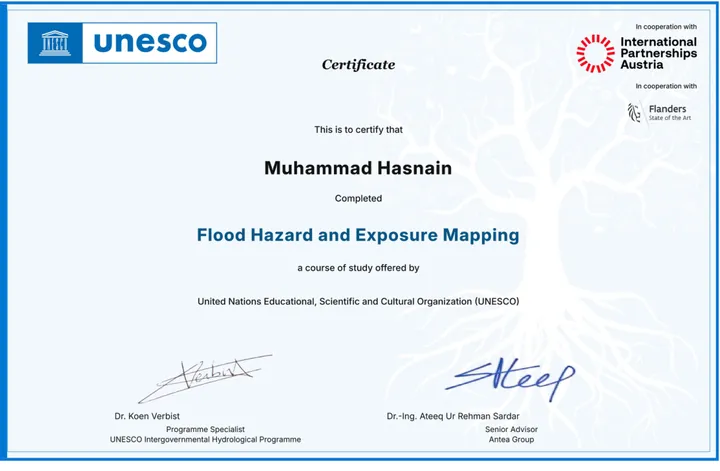
Flood Hazard and Exposure Mapping certificate, UNESCO, with International Partnerships Austria and Flanders
Flood Hazard and Exposure Mapping UNESCO, with International Partnerships Austria and Flanders, Sep 2026 Verify on UNESCO
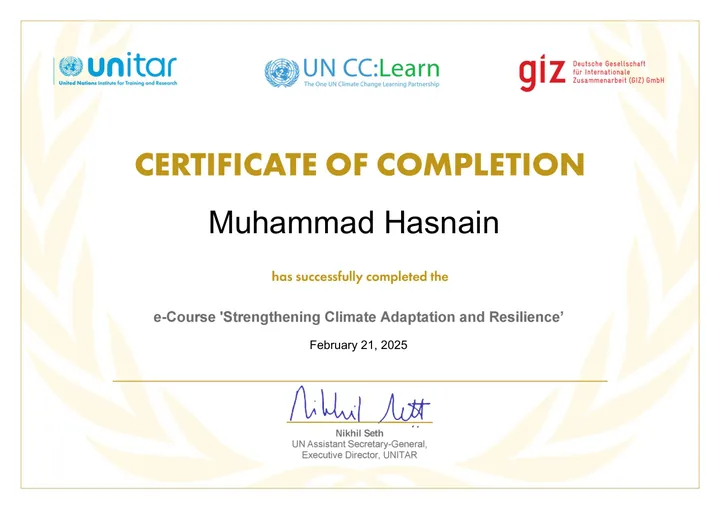
Strengthening Climate Adaptation and Resilience certificate, UNITAR, UN CC:Learn and GIZ
Strengthening Climate Adaptation and Resilience UNITAR, UN CC:Learn and GIZ, Feb 2025
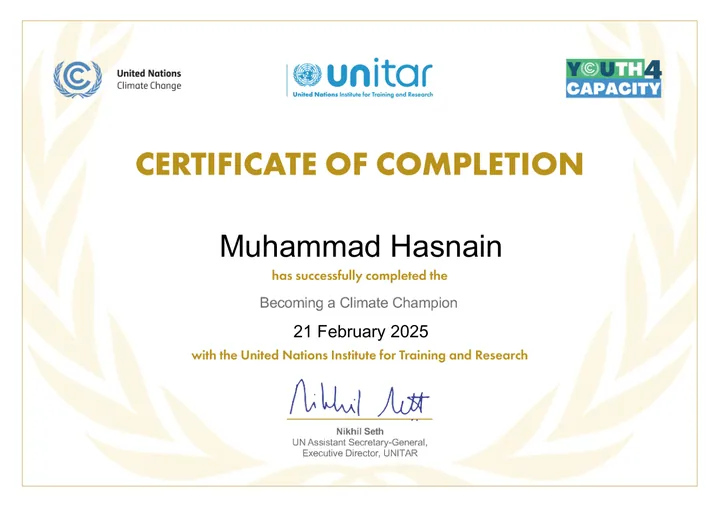
Becoming a Climate Champion certificate, UNITAR and UN Climate Change
Becoming a Climate Champion UNITAR and UN Climate Change, Feb 2025
Career Essentials in Generative AI certificate, Microsoft and LinkedIn
Career Essentials in Generative AI Microsoft and LinkedIn, Feb 2025
Career Essentials in Data Analysis certificate, Microsoft and LinkedIn
Career Essentials in Data Analysis Microsoft and LinkedIn, Mar 2025
Introduction to Artificial Intelligence certificate, LinkedIn Learning
Introduction to Artificial Intelligence LinkedIn Learning, Feb 2025
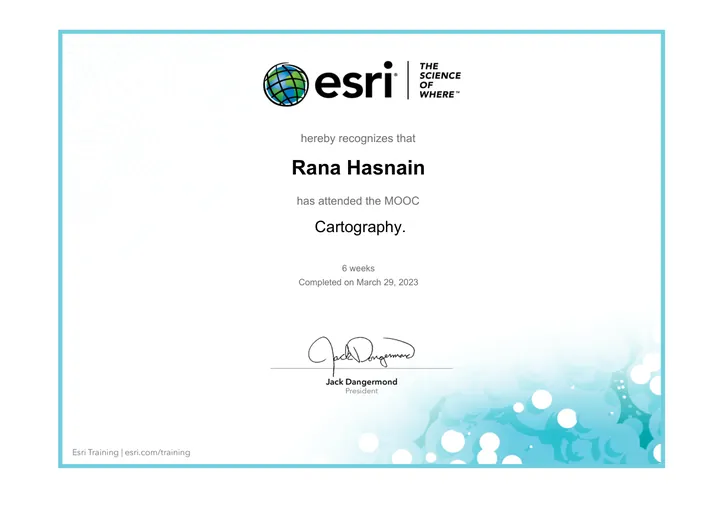
Cartography certificate, Esri, 6-week MOOC
Cartography Esri, 6-week MOOC, Mar 2023 Issued under the name Rana Hasnain
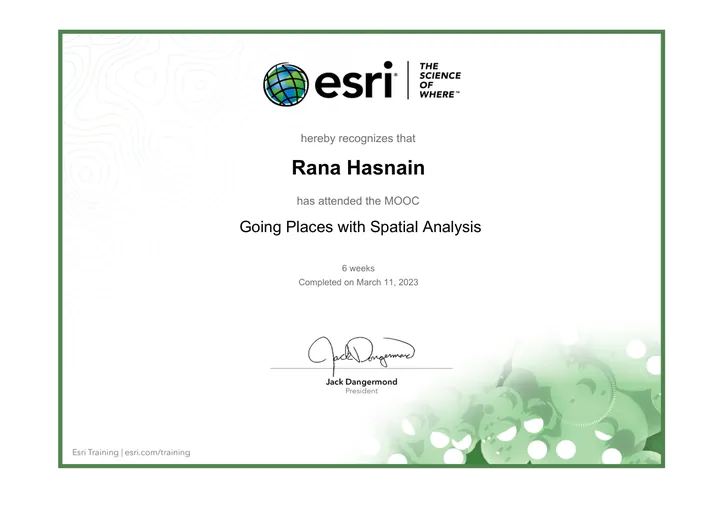
Going Places with Spatial Analysis certificate, Esri, 6-week MOOC
Going Places with Spatial Analysis Esri, 6-week MOOC, Mar 2023 Issued under the name Rana Hasnain
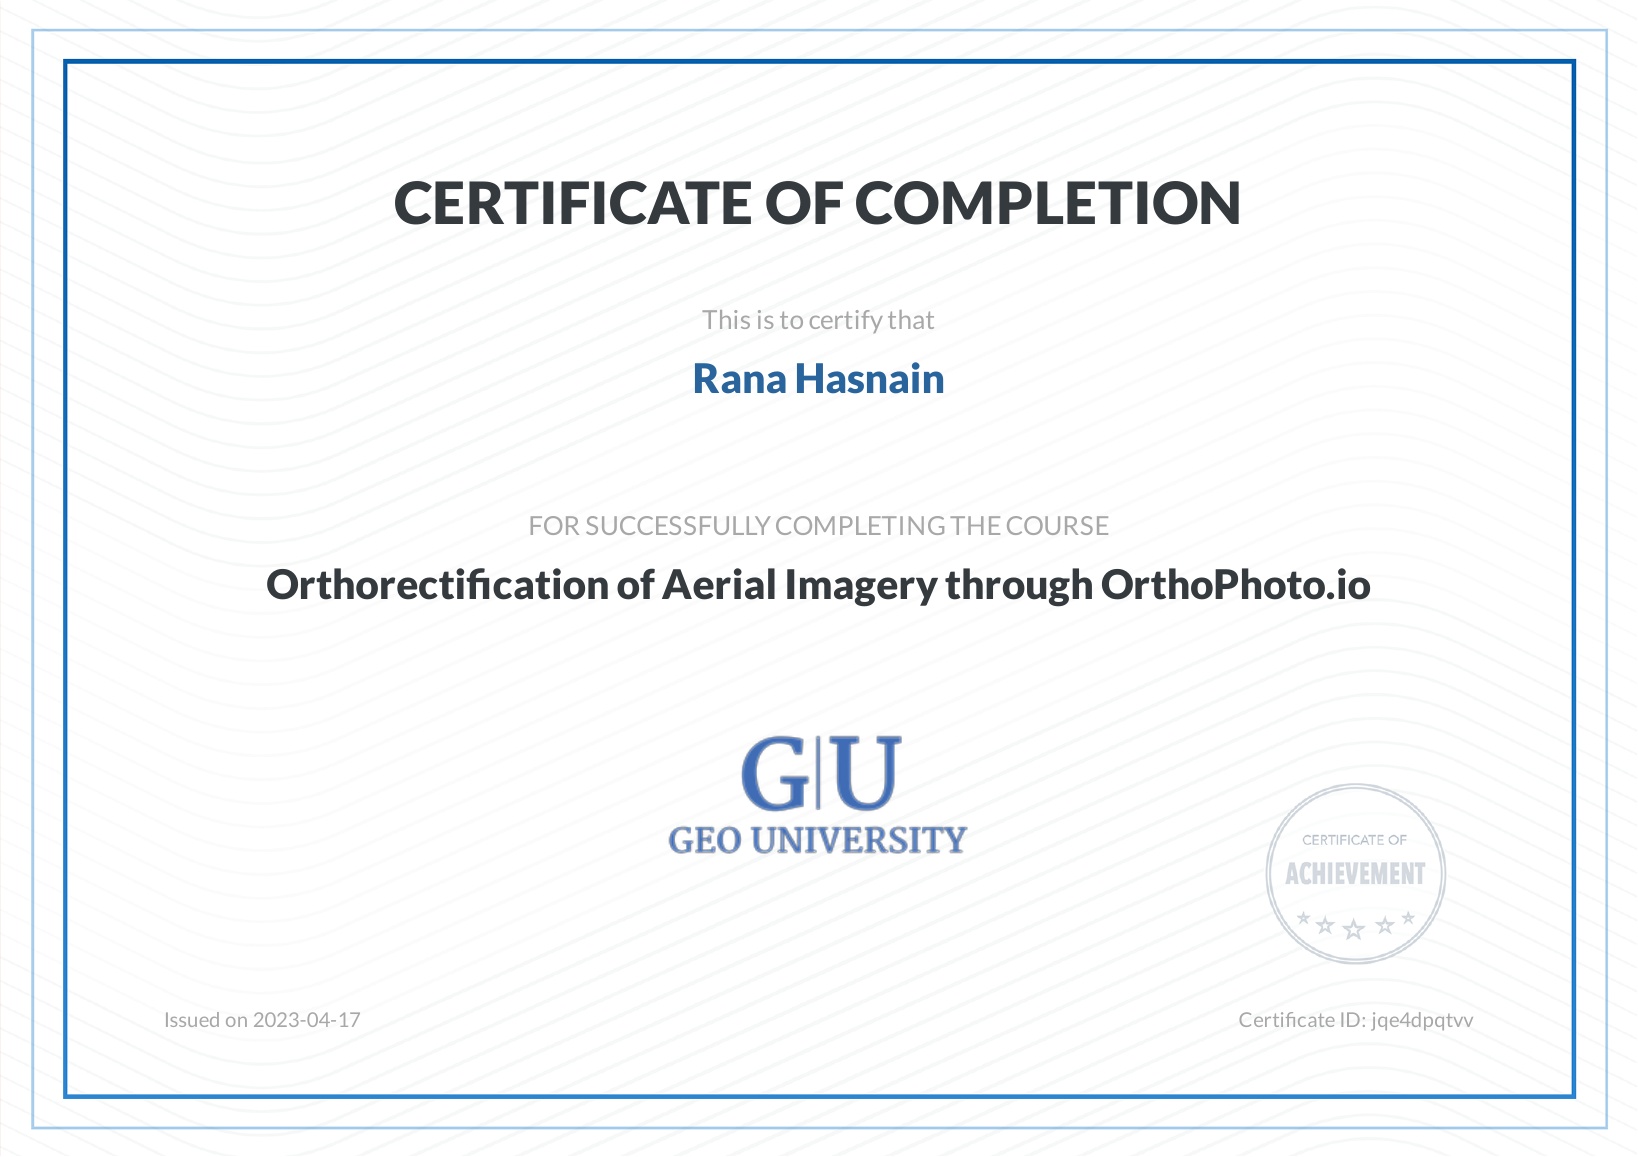
Orthorectification of Aerial Imagery through OrthoPhoto.io certificate, Geo University
Orthorectification of Aerial Imagery through OrthoPhoto.io Geo University, Apr 2023 Issued under the name Rana Hasnain

Also completed

  • Introduction to Machine Learning for Earth Observation, EO College

Training and volunteering

Workshops

  • DSSAT crop modelling workshop
  • Disaster management training on early warning
  • AGRISAT satellite data workshop

Volunteering

  • Pakistan Minerals Investment Forum 2025
  • Pakistan Learning Festival
  • Human Rights Commission of Pakistan (HRCP)
  • Federal Ministry of Education (DWE)

Languages

  • English, C1 (spoken B2)
  • German, A1

Get in touch

Open to work on climate risk, early warning and GeoAI.

ranahasnain061@gmail.com